


4.9 / 5 stars on


Copyright ©2024 Connected Colleges Pty Ltd Trading As Social Media College. All Rights Reserved.
Go from frustrated and overwhelmed to social media marketing guru with unlimited learning for all major platforms and topics

%20(1).webp)


Learn the exact strategies and tactics to become a social media marketing expert


Don’t take our word for it. Hear what real business owners and marketers have to say


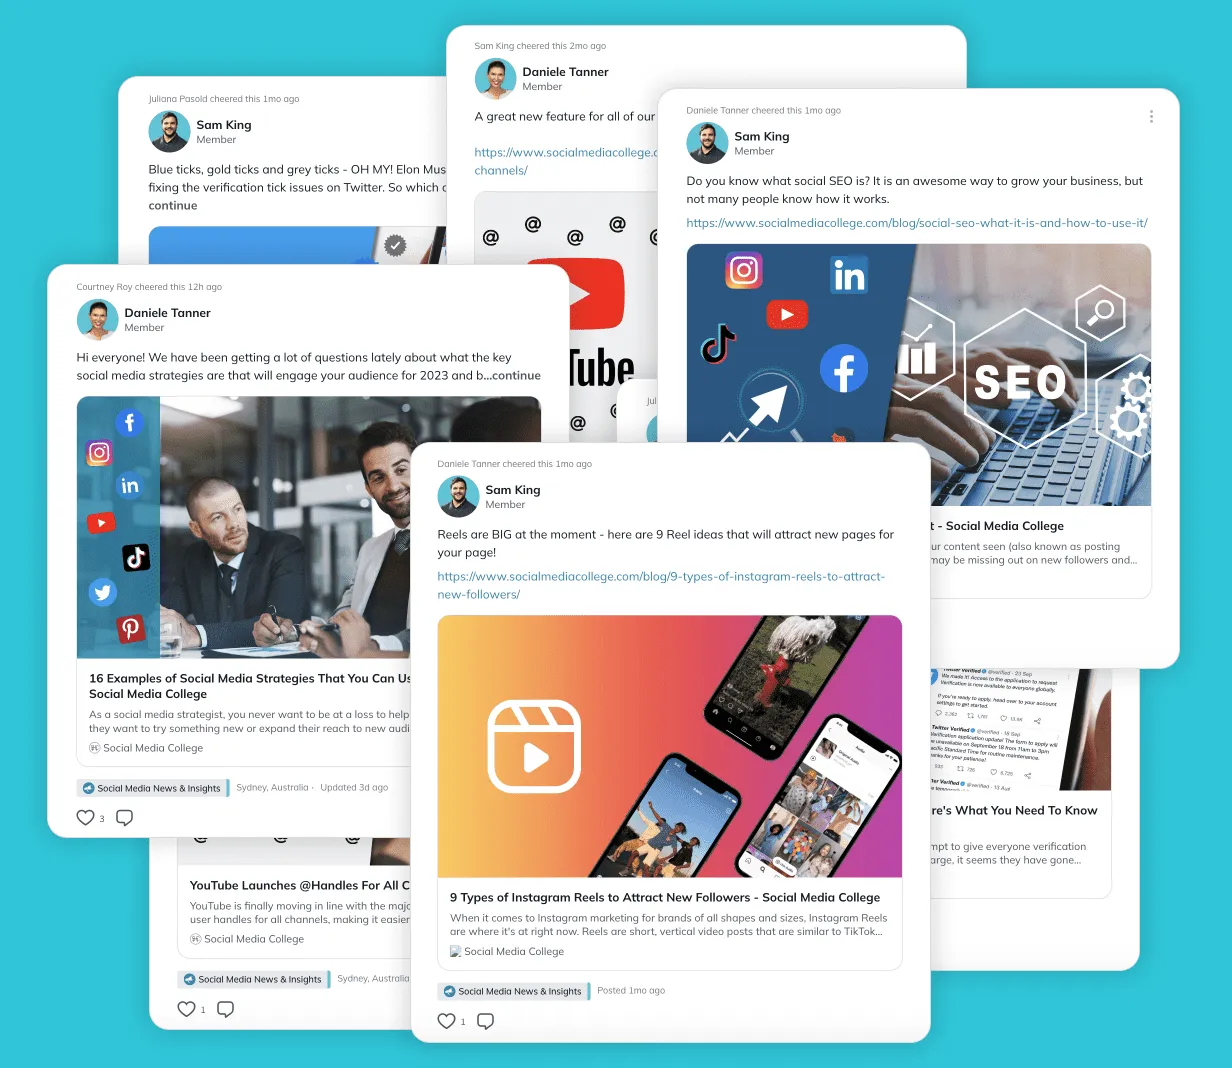
Our learning platform provides the skills, certificates, support and community for you to learn faster and achieve your marketing goals
.png)
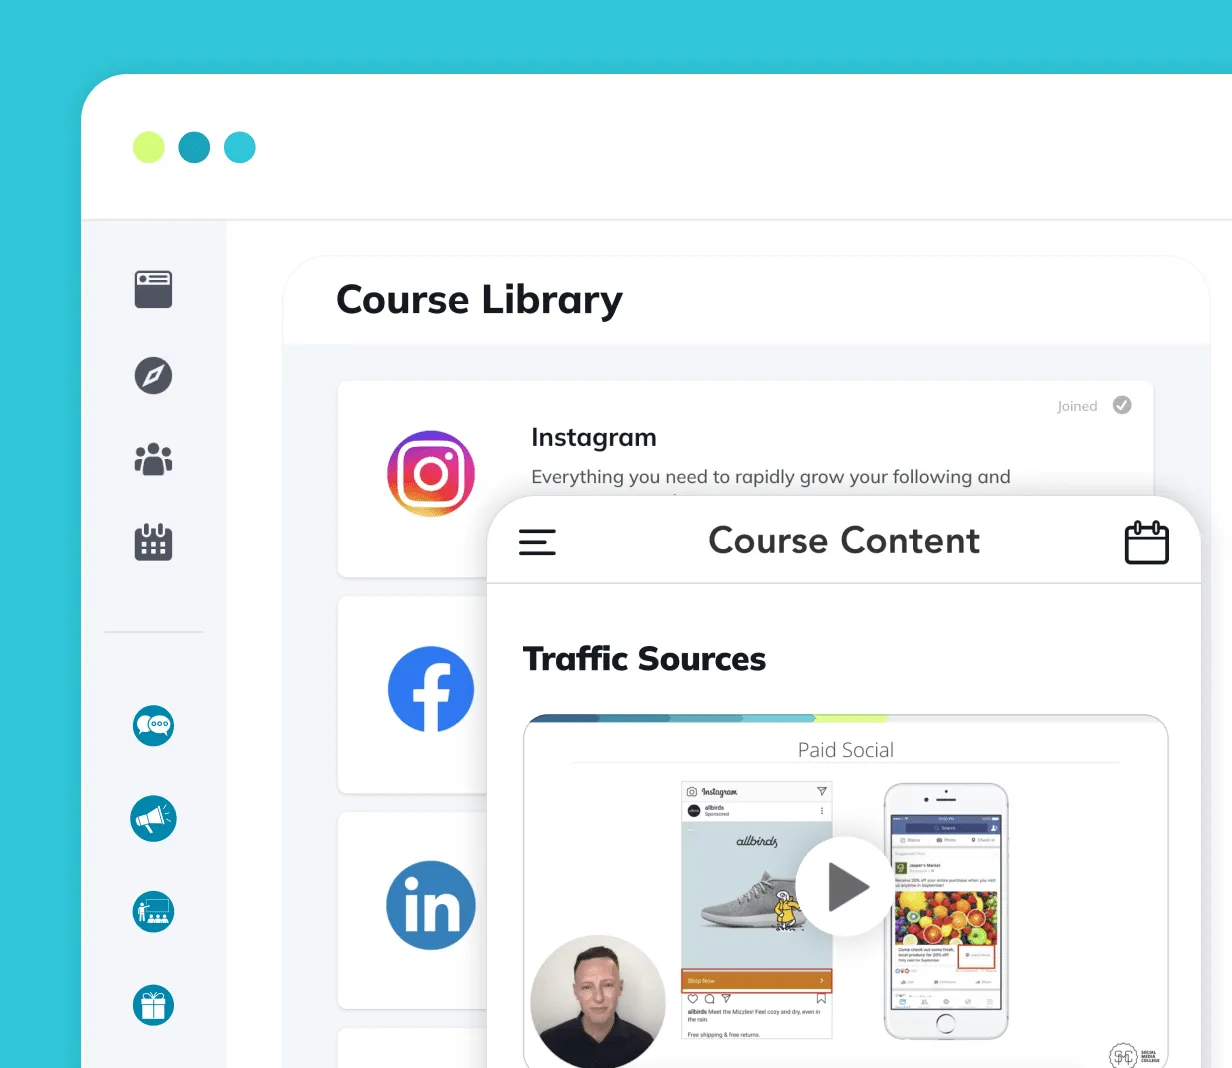
Get unlimited access to hundreds of video courses, live workshops and live masterclasses covering all major social media platforms and topics. Led by genuine industry experts, you'll learn practical, up-to-date strategies and tactics. It's a fun and engaging learning environment where you can study how you like, from anywhere you like.
.png)
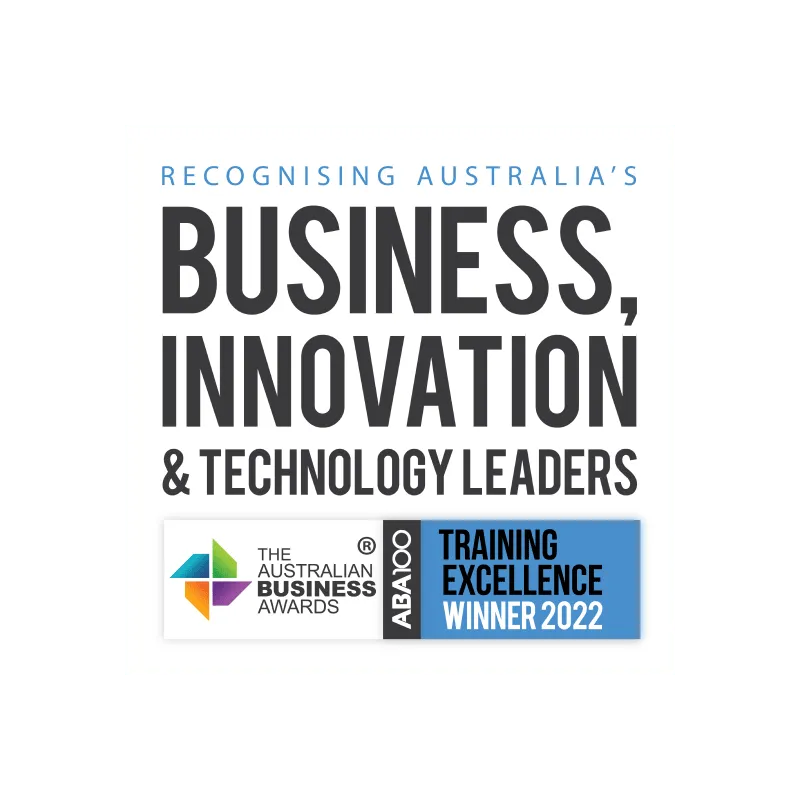
Get certified! Take globally-recognised certifications from Meta, Google, Hootsuite, Hubspot, and more. You'll confidently study and pass certification exams to earn blockchain-verified digital badges that make your LinkedIn and resume pop! Earn trust from clients and team, amplify your career prospects, and empower yourself to deliver standout campaigns.

.png)
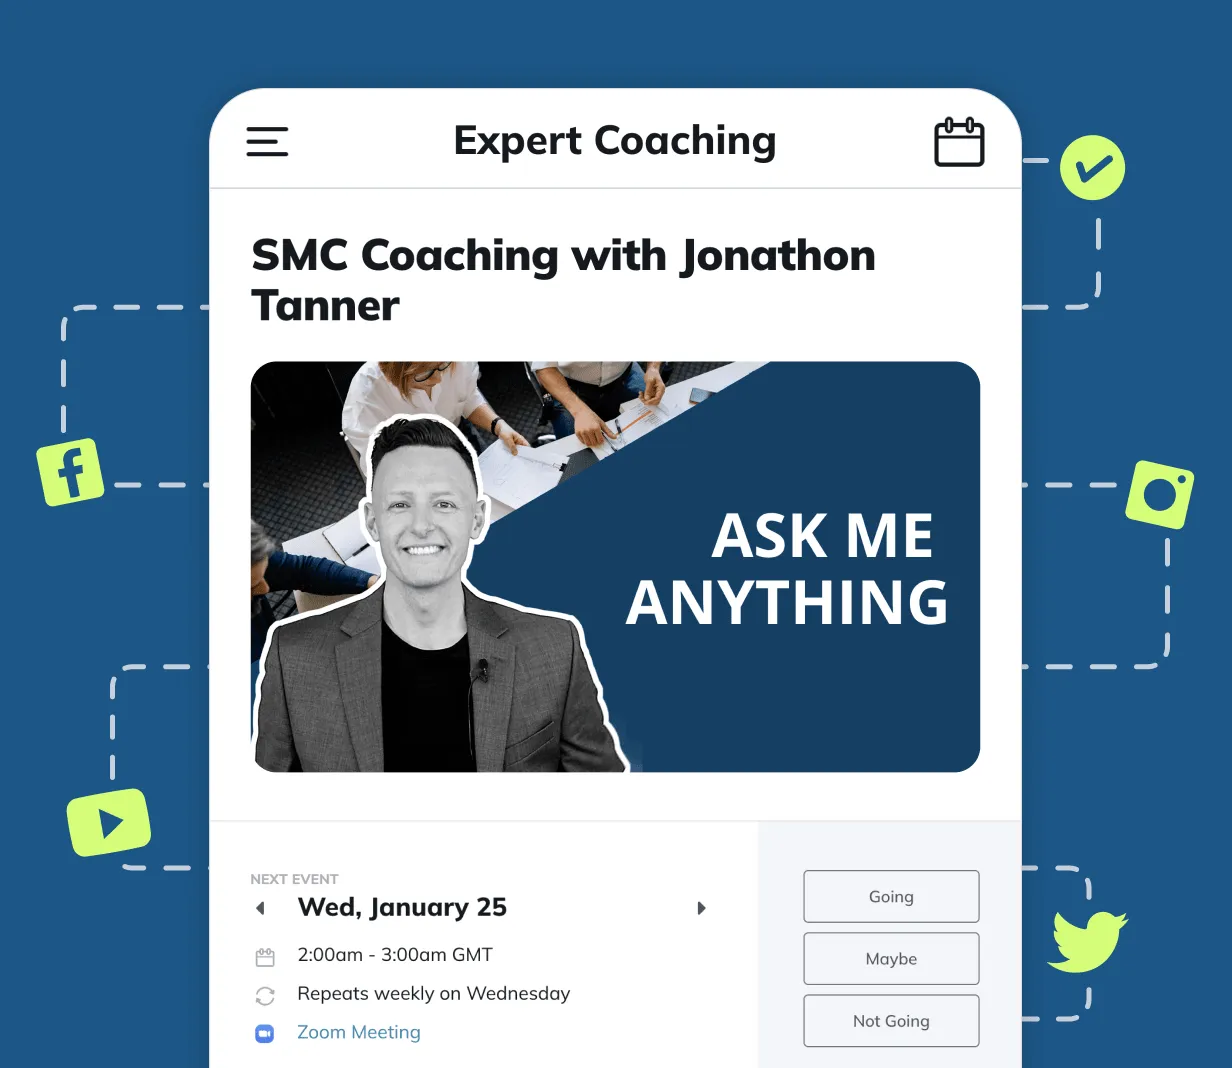
Bulldoze those roadblocks with real-life social media marketing support when you need it most. Daily group coaching sessions are hosted by friendly and non-judgmental industry experts. Ask whatever you like and learn from others at the same time. You'll back yourself to execute your organic and paid social media campaigns and never lose momentum again.
.png)
Don't be a lone wolf! Join thriving global community of business owners, marketers and agency owners. Showcase your skills, celebrate your wins and discover fresh opportunities. Network and collaborate with like-minded peers and ensure you're never alone on your social media journey.

.png)
Struggling to keep up with all the social media changes? We'll keep you current with research, tactics and news, including new feature released by the social media platforms. Plus, gain access to software discounts, templates, case studies, benchmarks, calculators, and more. All in one convenient location.
Go from frustrated and overwhelmed to social media marketing guru with SMC’s all-in-one learning platform.

Rapidly scale revenue with social media

Plus paid advertising campaign support

Find resources, suppliers, clients and partners
Leo Clifford
Director, Ramp Up Recruitment
.png)
“SMC made my life easier and my business a lot more successful. The return on investment is HUGE!”
-min.png)
Jane Maloney
Social Media Manager, Winning Appliances
"You will be able to thrive with the Mentorship."
Learn an exciting and in-demand skillset, earn what you deserve and become the person people turn to for advice
Grow sales and lower marketing costs

Accelerate your career & stand out from the crowd

Get industry news, insights and platform updates
Find the confidence and freedom to work wherever and whenever you like by providing social media services to clients
Delight clients with every campaign
Earn industry-recognised certifications
Daily group coaching to overcome challenges
Erika Buckton
Co-Founder, Eks & Oh Digital Marketing
.png)
“It all started with SMC. I made my investment back in the first month”
Get the job done, cheaper. Access discounts from leading social media marketing software your love.

Get 25% off all plans

Get 10% off annual subscriptions

Get 30% off 6 / 12 month plans

14 day free trial and 10% off
.webp)
Get 5% off business plan

Get 50% off paid plans

Get 20% off first 3 months

Get 10% off first purchase

Get 50% off business plans
.png)
Get 20% off all plans
.png)
Get 10% off all plans

Get a 45 day free trial PLUS 20% off all plans


Copyright ©2024 Connected Colleges Pty Ltd Trading As Social Media College. All Rights Reserved.